
Alessandra Carioli (Netherlands Interdisciplinary Demographic Institute) prepared this overview based on her study presented at EPC 2014 in Budapest “A Spatial Analysis of Recent Fertility Patterns in Spain”. This study won one of the poster awards at EPC 2014 and is co-authored together with Daniel Devolder (Centre d’Estudis Demographics, UAB) and Joaquin Recaño (Centre d’Estudis Demographics, UAB). For any feedback contact carioli@nidi.nl.
Demographic phenomena are inherently spatial as human populations are not randomly located in space and settlement patterns are dependent on structural geographical attributes. In this context, spatial analysis focuses on the role of space in explaining the phenomenon under investigation, exemplified by Tobler’s First Law of Geography: “everything is related to everything else but near places are more related than far places” (Tobler, 1970). The spatial dimension of demographic phenomena has proved to be of great importance in understanding the role of personal characteristics and the impact of the environment on such attributes. Nevertheless, most studies tend to ignore this spatial dependence. For instance, if we consider the level of total fertility rate (TFR), we can say that space matters if TFR is spatially autocorrelated, that is to say areas show some degree of dependency, with similar values for neighboring areas. This is an important point, since the presence of spatial autocorrelation may suggest the existence of unobserved variables not included in the model.
Recalling Tobler’s First Law of Geography, distance and neighboring relations between different areas can be particularly telling to what degree does the spatial dependence exist and on “how closed do places need to be” in order to be related, or spatially autocorrelated. Of the various tools used in spatial econometrics to understand spatial dependence, Moran’s I Index (Moran, 1950) is one of the most used statistics as it helps quantifying the global level of autocorrelation and discern whether we are dealing with a random phenomenon. 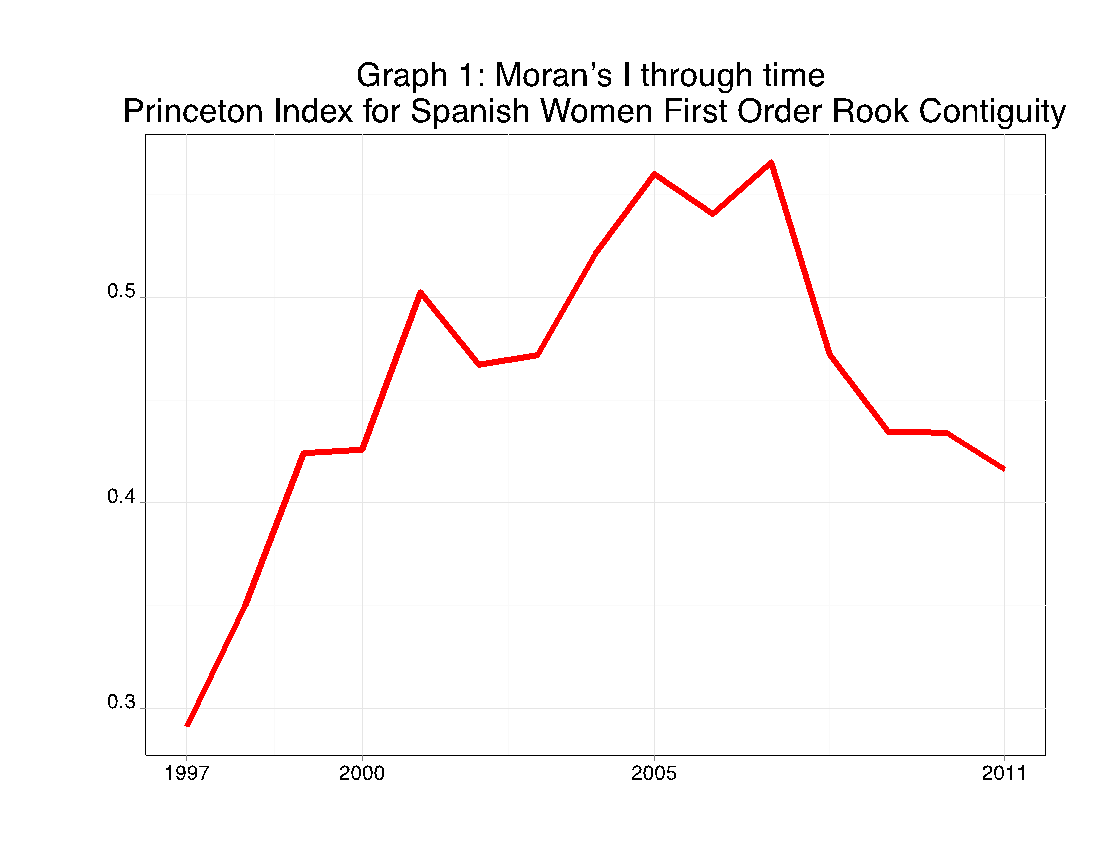 Nevertheless, Moran’s I does not tell us the ‘whole story,’ and we need to complement it with other tools such as covariogram, correlogram or variogram analysis, which relate spatial dependence to distance by means of covariance, correlation and semivariance across neighboring observations respectively (Griffith & Paelinck, 2011: chapter 3) and local measures of spatial association, such as local Moran’s I to evaluate clustering and significance for each spatial unit.
Recent works in the field of spatial demography have evidenced that adding the time dimension to spatial analysis can provide insights about the adoption of a new demographic regime and how its constituent variables are impacted through time. This is an important matter, as we learned from the Princeton project that the spatial dimension is crucial to understand the diffusion processes during the First Demographic Transition in Europe (Coale & Watkins, 1986). However in most of the studies of the Second Demographic Transition, the spatial component is often overlooked. This is in part due to data availability and also because demographic transitions are thought of as the result of a country specific processes. But focusing on the national level rather than the local one when analyzing changes in the demographic regime, we generally miss out precursors as well as laggards. One classical example in Spain is the region of Catalonia, which was a precursor for both the First and the Second Demographic transitions compared to the rest of the country and specifically Southern regions. 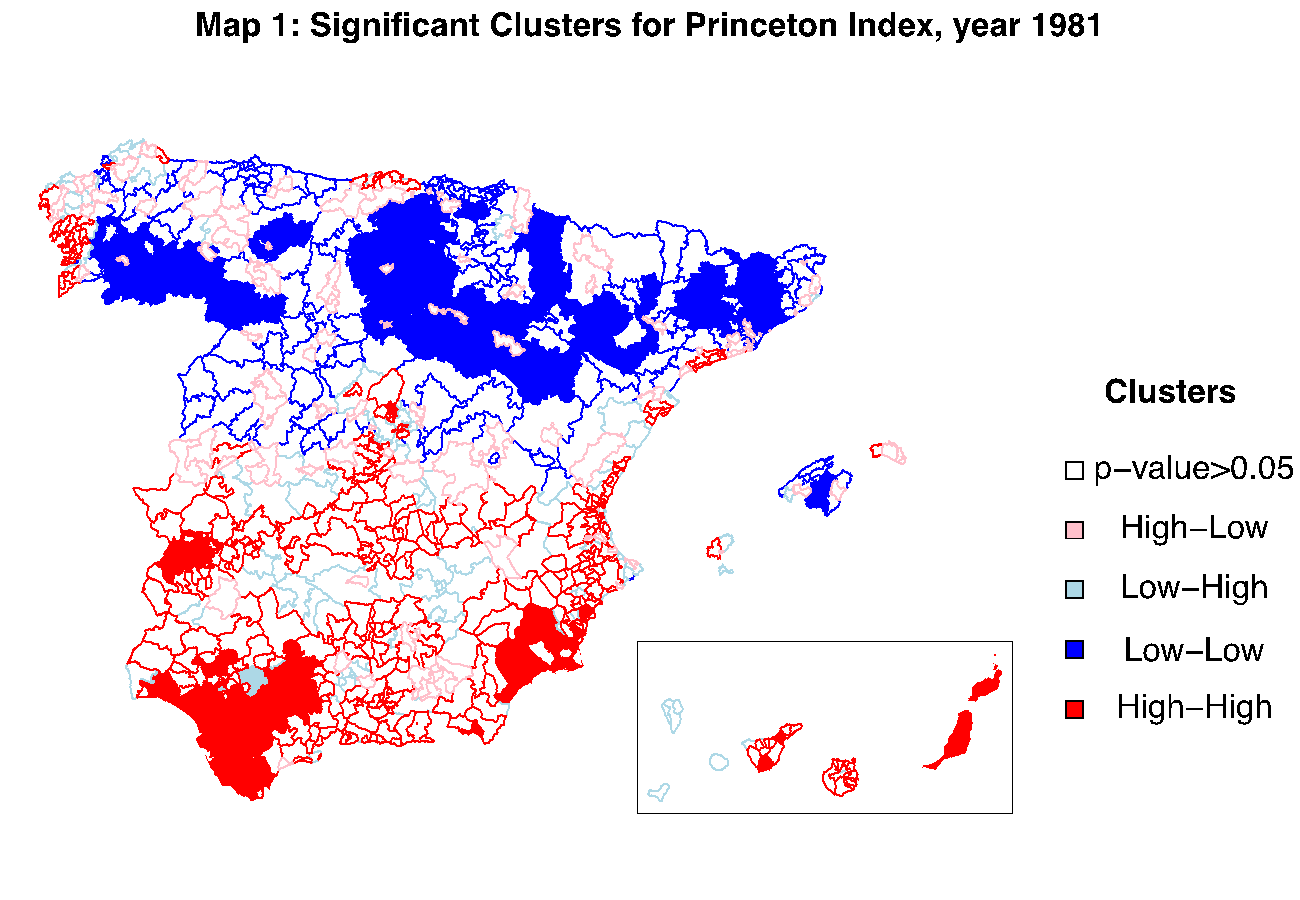
The most simple and practical way of understanding how spatial dependence has evolved through time is by means of local statistics of spatial association, in which we test whether and where clusters of areas with similar features exist. Anselin (1995) suggested local indicators for spatial association, LISA, a technique similar to Moran’s I, but computed and evaluated for each spatial unit, comparable to a linear regression between the variable measured at a certain location and the same variable measured at every neighboring location(s).
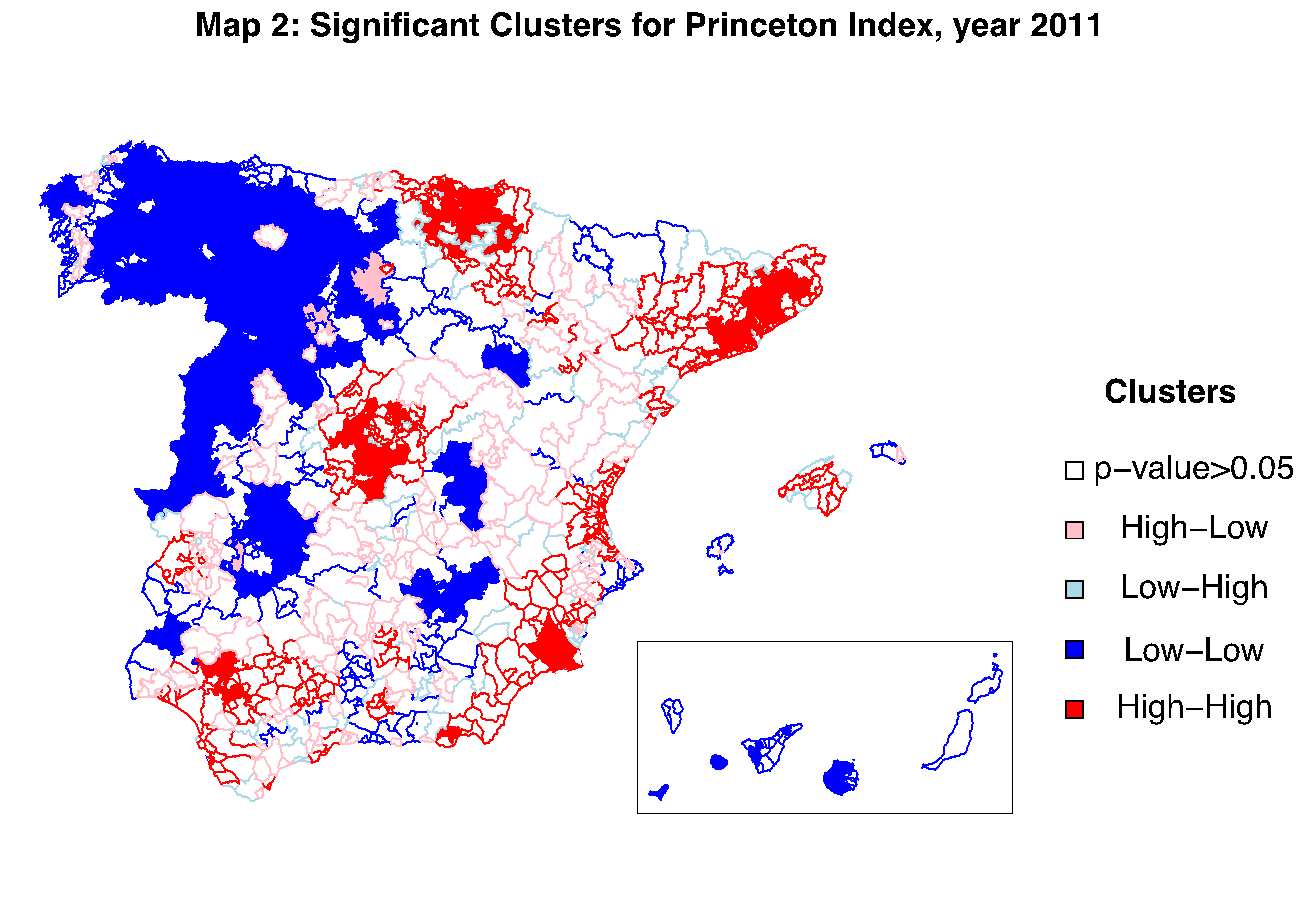
Therefore, it is quite straightforward to see how spatial autocorrelation can alter the result of a study that does not take space into consideration, hence the old property adage, “location, location, location!” can also apply also to demography. In the context of spatial heterogeneity of fertility, Spain is a unique country in Europe, with a long and well-documented regional and provincial diversity for more than two centuries. Having a look at municipal fertility changes over the last three decades can be very indicative of how 1. Fertility declined with different paths, 2. The recent recuperation of fertility has interested only determined areas until the onset of the recent economic crisis, 3. Migration has deeply affected fertility patterns in big cities, but left other regions unaffected. Looking at global measures of autocorrelation (see Graph 1), we can understand why spatial dependence is a time evolving phenomenon that can change and reverse its path. For instance, Graph 1 depicts how in times of economic -and fertility- expansion, spatial autocorrelation reaches its peak, while in times of economic recession -and fertility decline- it plummets, leveling off much of fertility differentials across regions. This is mainly due to the way individuals try to cope with distressed times by delaying births until better times come. The two LISA cluster maps group the variable of interest, in this case Princeton Index, using a four-groups local statistic divided as: red high-high clusters of areas with -relatively- high fertility surrounded by high fertility, dark blue low-low clusters, light red high-low clusters of high fertility areas surrounded by low fertility and light blue low-high clusters. The traditional division of Spain into high fertility South and low fertility North has been shifted from the mid-90s into an East-West divide with big cities as hot-spots for high fertility, as shown in the LISA maps 1 and 2.
Although spatial techniques in demography are often applied to small areas, the large scale approach can address big questions when a more heuristic method fails. Mapping can be a powerful tool to understand geographic dynamics, but without econometric tools, important issues such as randomness and statistical significance may substantially bias our results. Moreover, GIS data collection is becoming more and more common in demography and space will definitely shed new light on demographic phenomena.

could you specify the Princeton index ?
Hi Boris,
the Princeton Index is a synthetic measure of fertility. In this article we use “If”, the childbearing index for women in reproductive age regardless of their marital status. This index was first proposed by Coale(1969) to compute fertility for populations where it was not possible to have age-specific levels. It requires only the total number of births during a certain calendar year, the female population age distribution (Wi) and the observed marital fertility of the Hutterites (Hi, Henry, 1961). For formula details see Preston, Heuveline and Guillot, “Demography”, ch. 5, p.97. What you will obtain is a measure of fertility explained as a fraction of that of the Hutterites (TFR=12.44). This method gives less weight to age-intervals, which measured at municipal level can create a lot of variability. Thus, we can say that it renders the measure of fertility more stable thanks to the standardization introduced by Hi.
Further reading:
Coale, A. J. 1969. “The Decline of Fertility in Europe from the French Revolution to World War II”. In S. B. Behrman, L. Corsa and R Freedman, Fertility, Family and Planning: A World View. Ann Arbor: University of Michigan Press.
Coale, A. J. and Cotts-Watkins S. 1986. The Decline of Fertility in Europe. Princeton University Press.
Henry L. 1961. “Fécondité et Famille. Modèles Mathématiques (I)”. Population, 12(3):413-444.
Preston S. H., Heuveline P. and Guillot M. 2001. Demography: Measuring and Modelling Population Processes. Blackwell Publishing, Oxford, UK.
Thank you, Alessandra, for your prompt reply.
There is Russian translation of Coale’s paper in which he had introduced his indices. In Russia we call them Coale’s indices. Precept in his dictionary also used Coale’s fertility indices. Thus I was uncertain about the term you used in your text.
[…] Location, location, location! Why space matters in demography and why we should care.. […]
[…] Blogpost on Demotrends: Location, location, location! Why space matters in demography and why we should care. https://demotrends.wordpress.com/2014/11/06/location-location-location/ […]
This blog post provides valuable insights into how space influences demographics.